
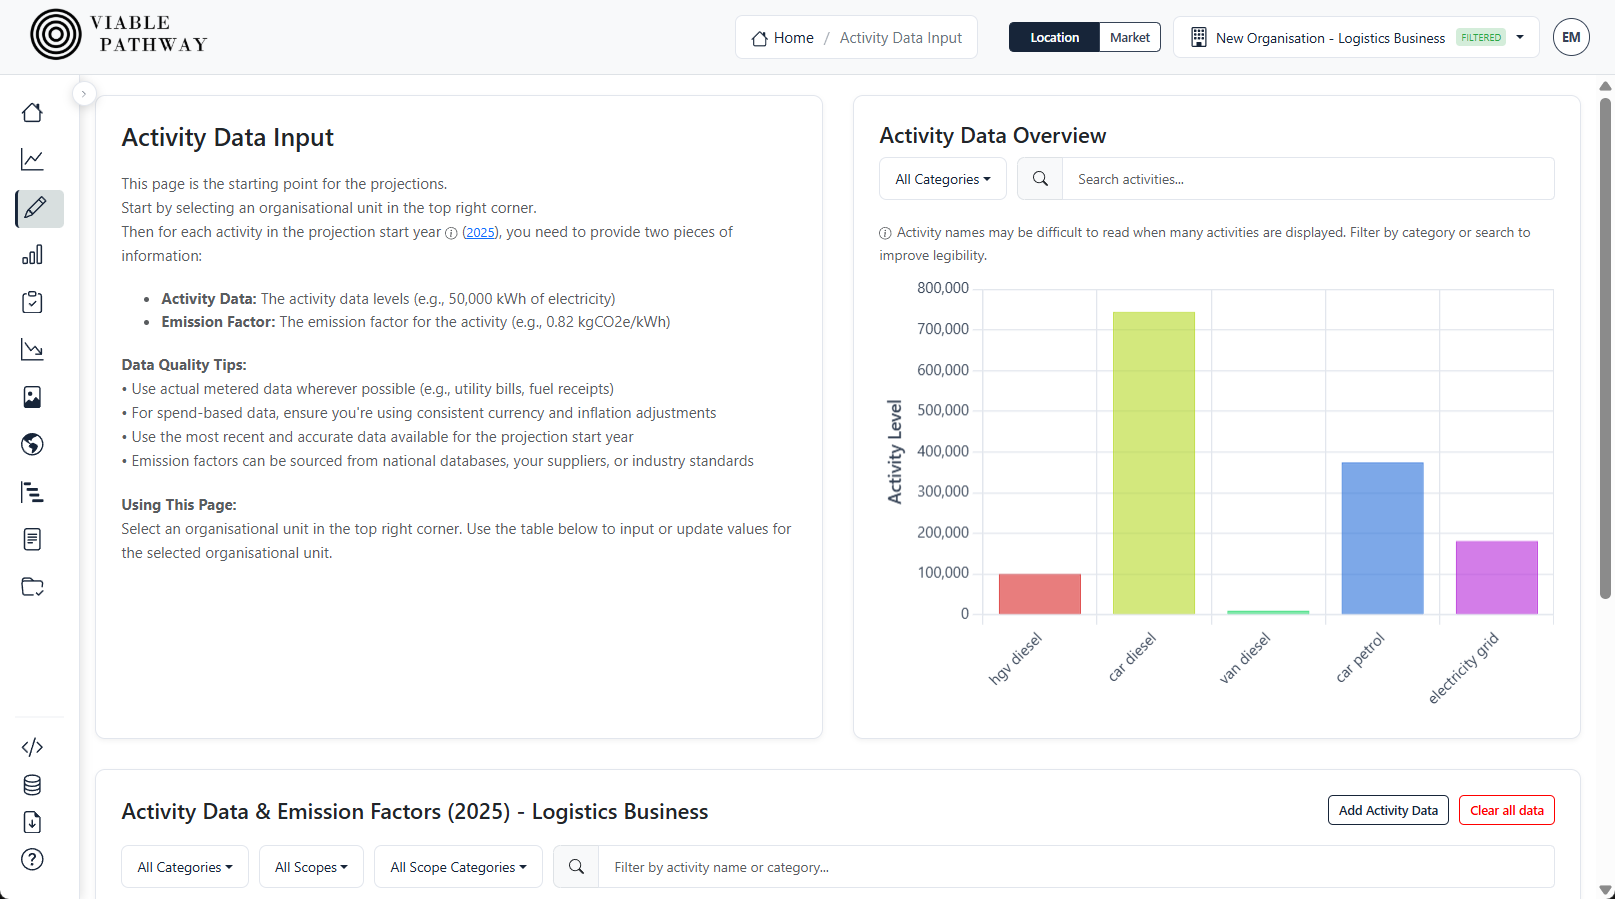
Start with your inventory
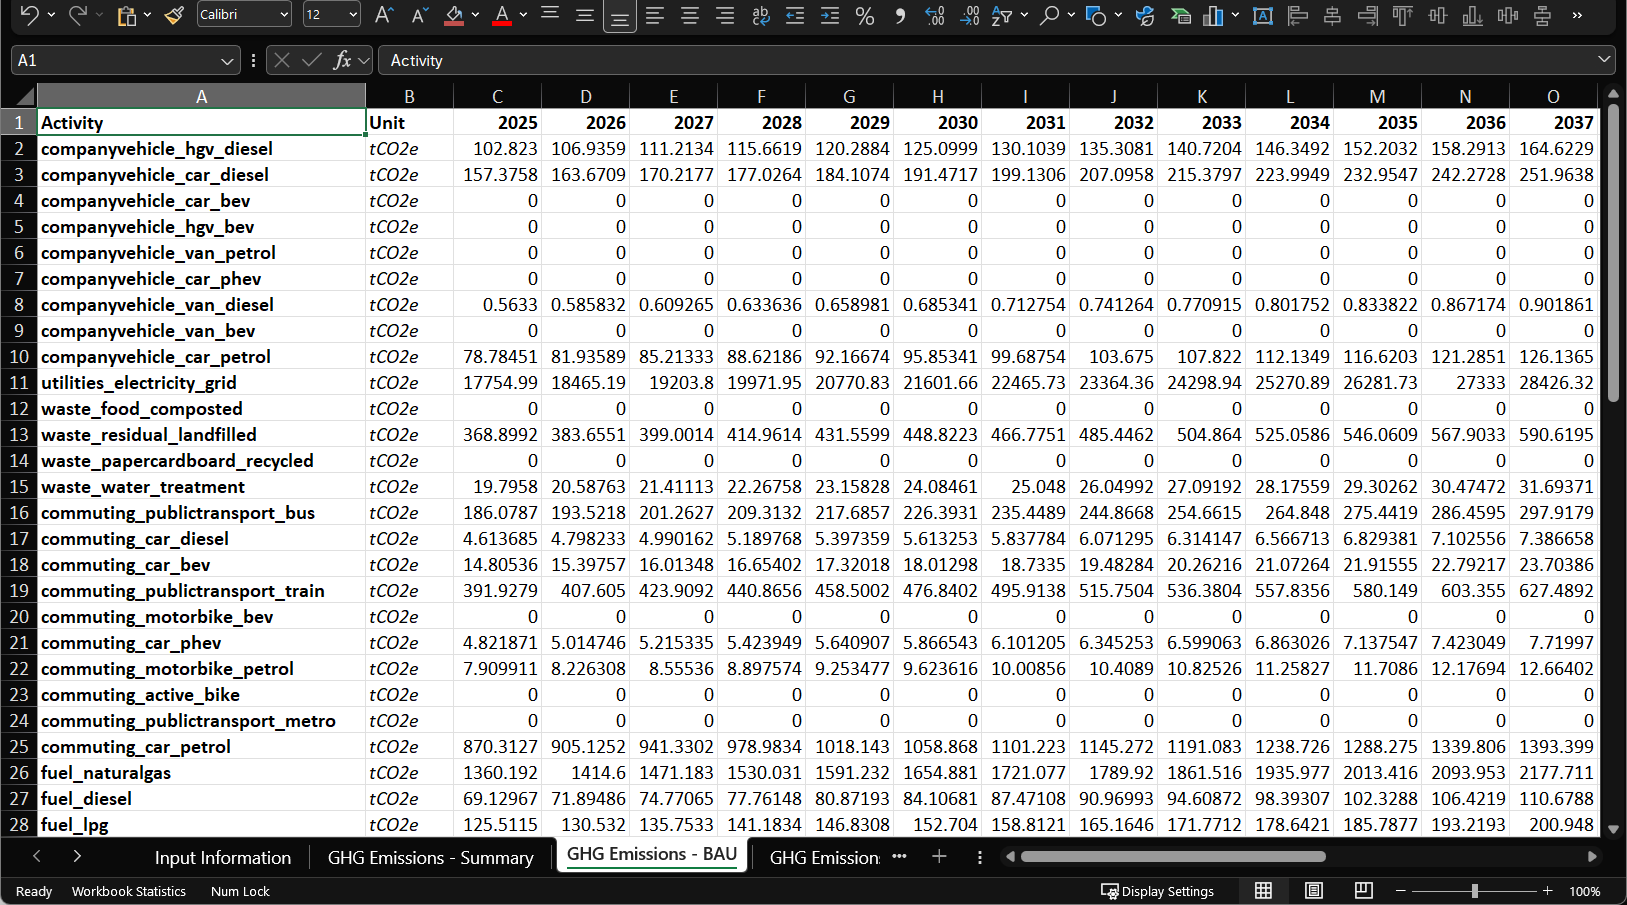
Add your activity data and emission factors into the tool to kick off the projection engine.
app.viablepathway.net
Turn your GHG inventory into a forward-looking, scenario-driven transition plan, allowing you to prioritise on the most important actions for reducing your emissions.
Thanks to our beta testers and early customers
Logos scroll horizontally: Baringa, Cibus Equity, Climate Zero, Edge Impact, NetNada, Ramboll, RSM, and others.
Viable Pathway gives you more confidence to build robust climate transition plans.
A target is only useful if you can show how you might get there and defend it to your board, auditors, or investors.
How we help
Model pathways from your current footprint forward, layer SBTi or custom target lines, and see the gap to close—so you set a number that is ambitious and explainable.
Long lists of initiatives hide trade-offs. You need to know which actions move emissions—and which ones are worth the money.
How we help
See carbon and cost side by side, including a MAC-style view, so you can re-order the plan and focus on the highest impact next steps.
The plan only lands if finance can see the bill. A pathway without a cost story rarely survives budget season.
How we help
Tie abatement to cost for each action and for the path to your target, then take numbers and the full data through to the CFO or your client—using built-in reports and export.
Add your activity data and emission factors into the tool to kick off the projection engine.
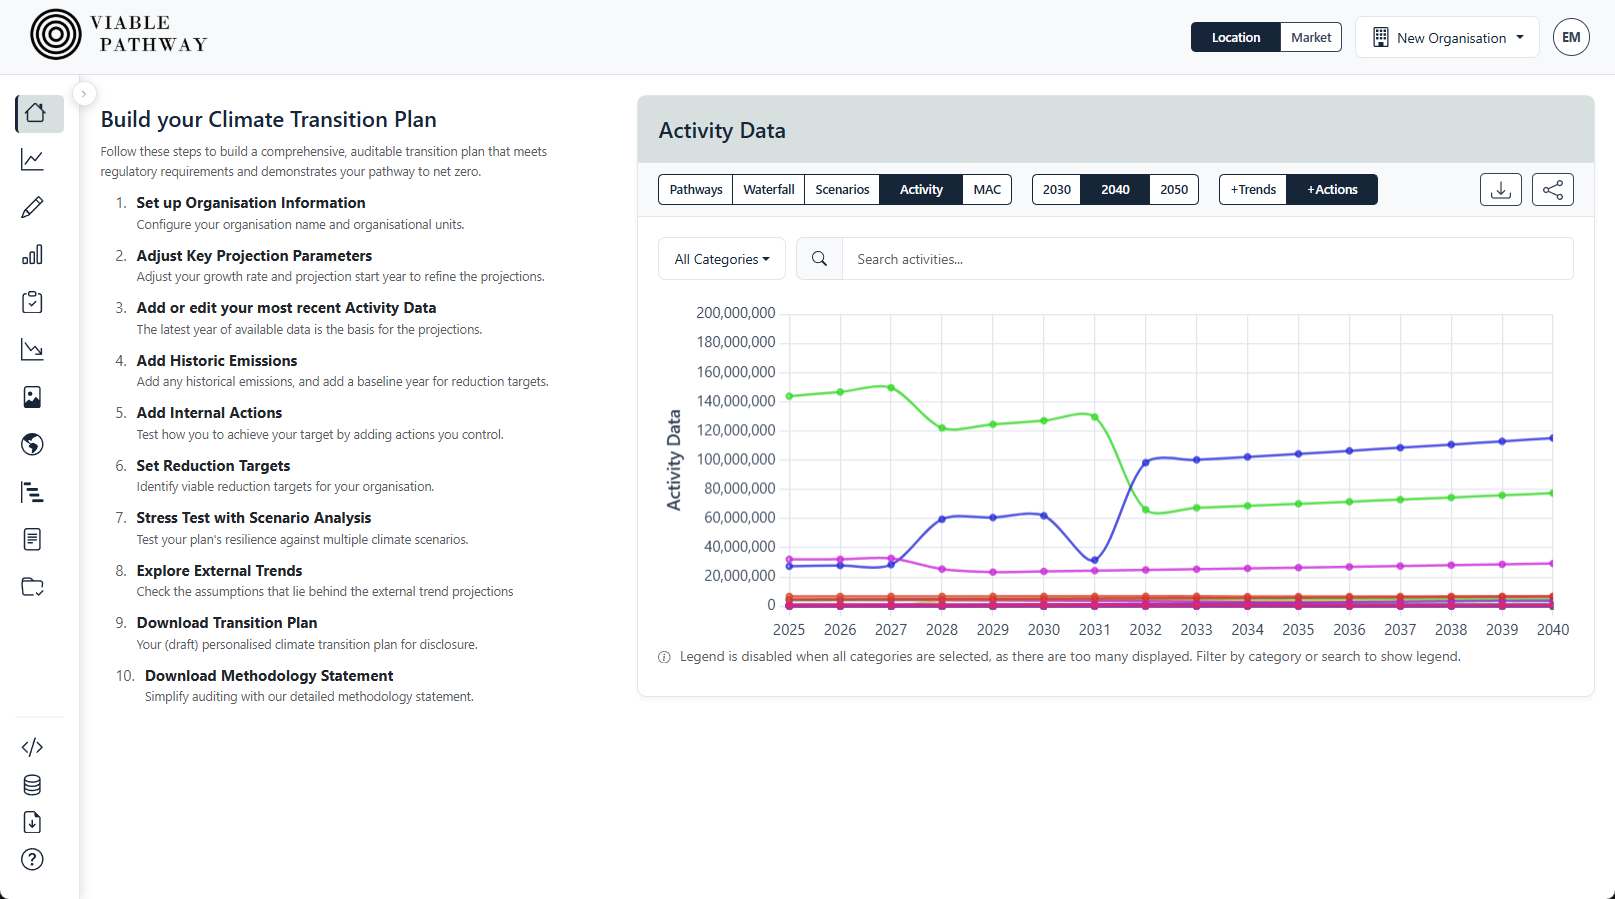
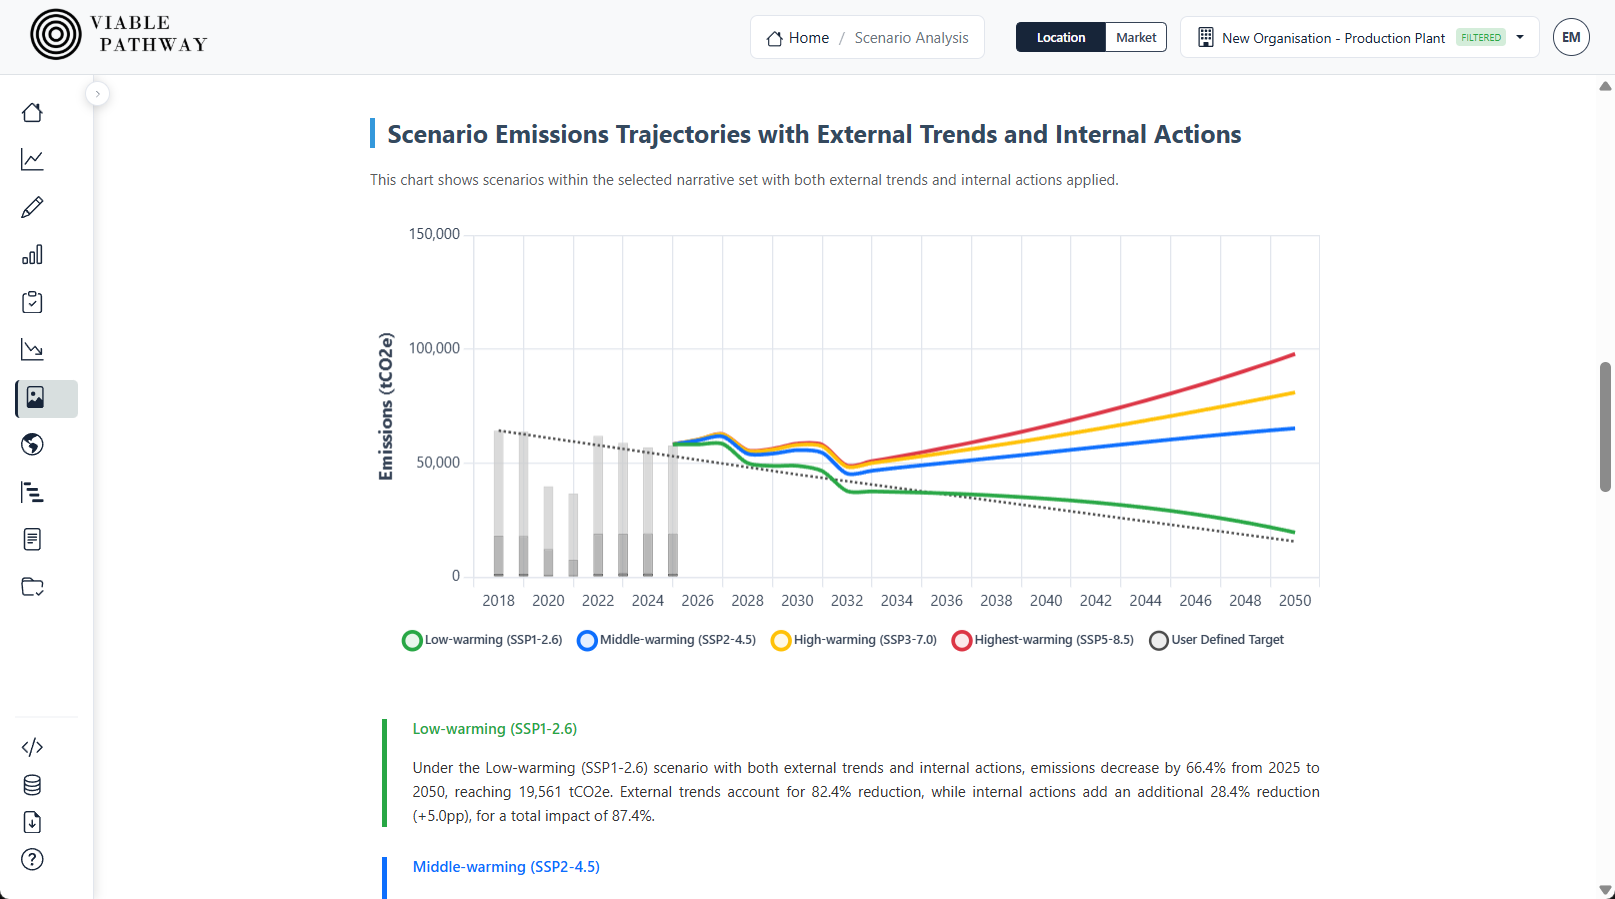
The projection engine models each individual activity into the future, taking account of external trends and internal actions. The advanced modelling takes account of competing actions if they cannibalise each other.
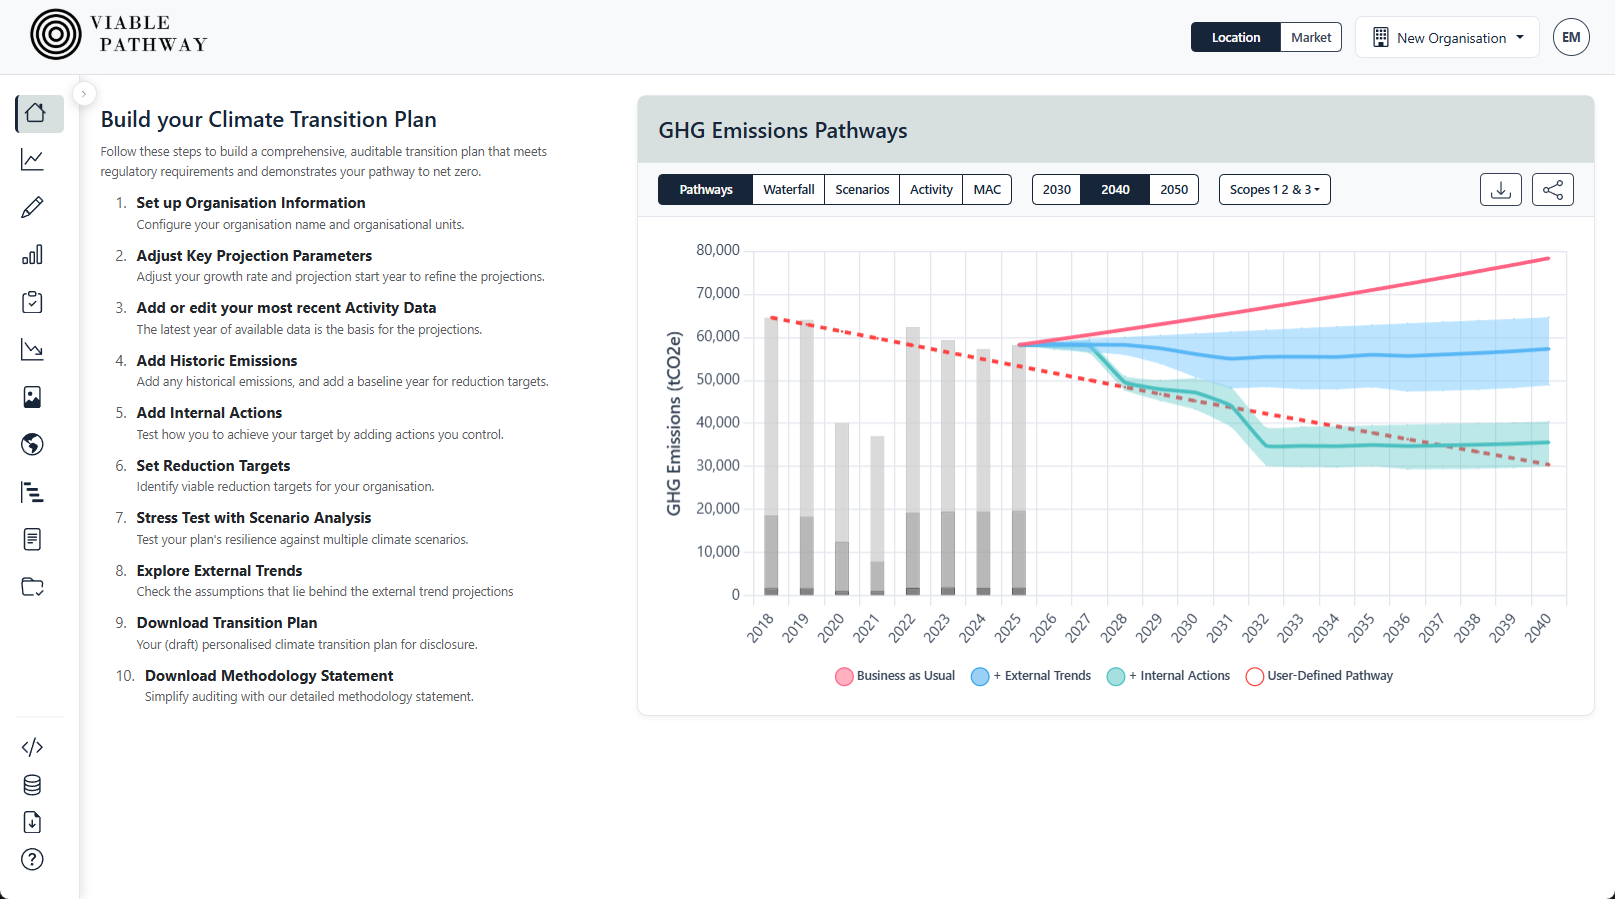
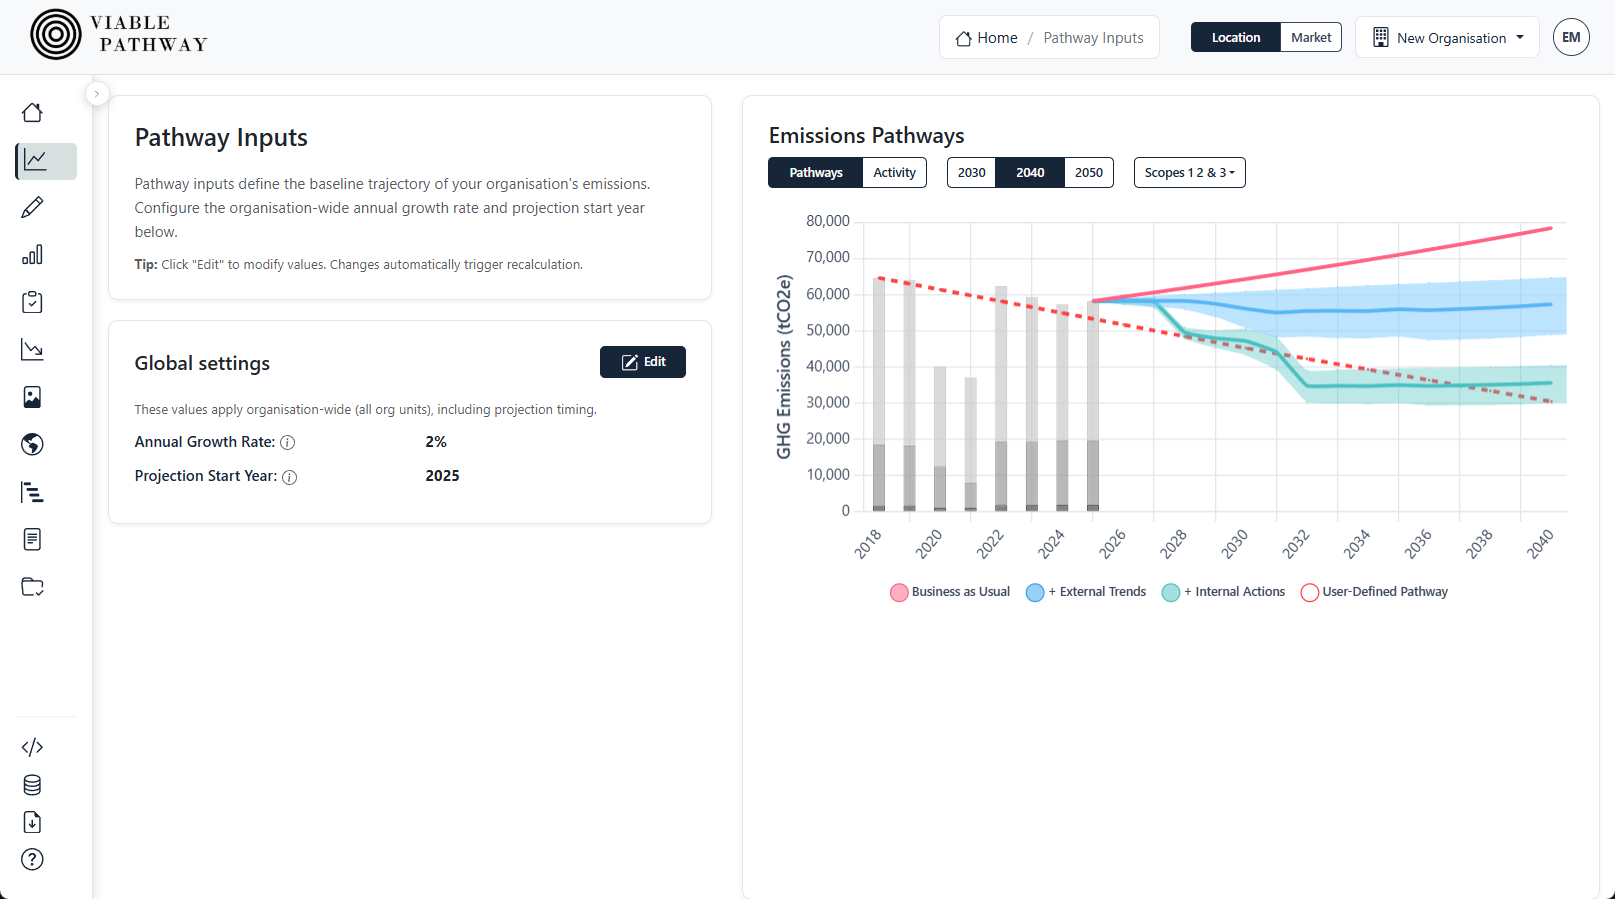
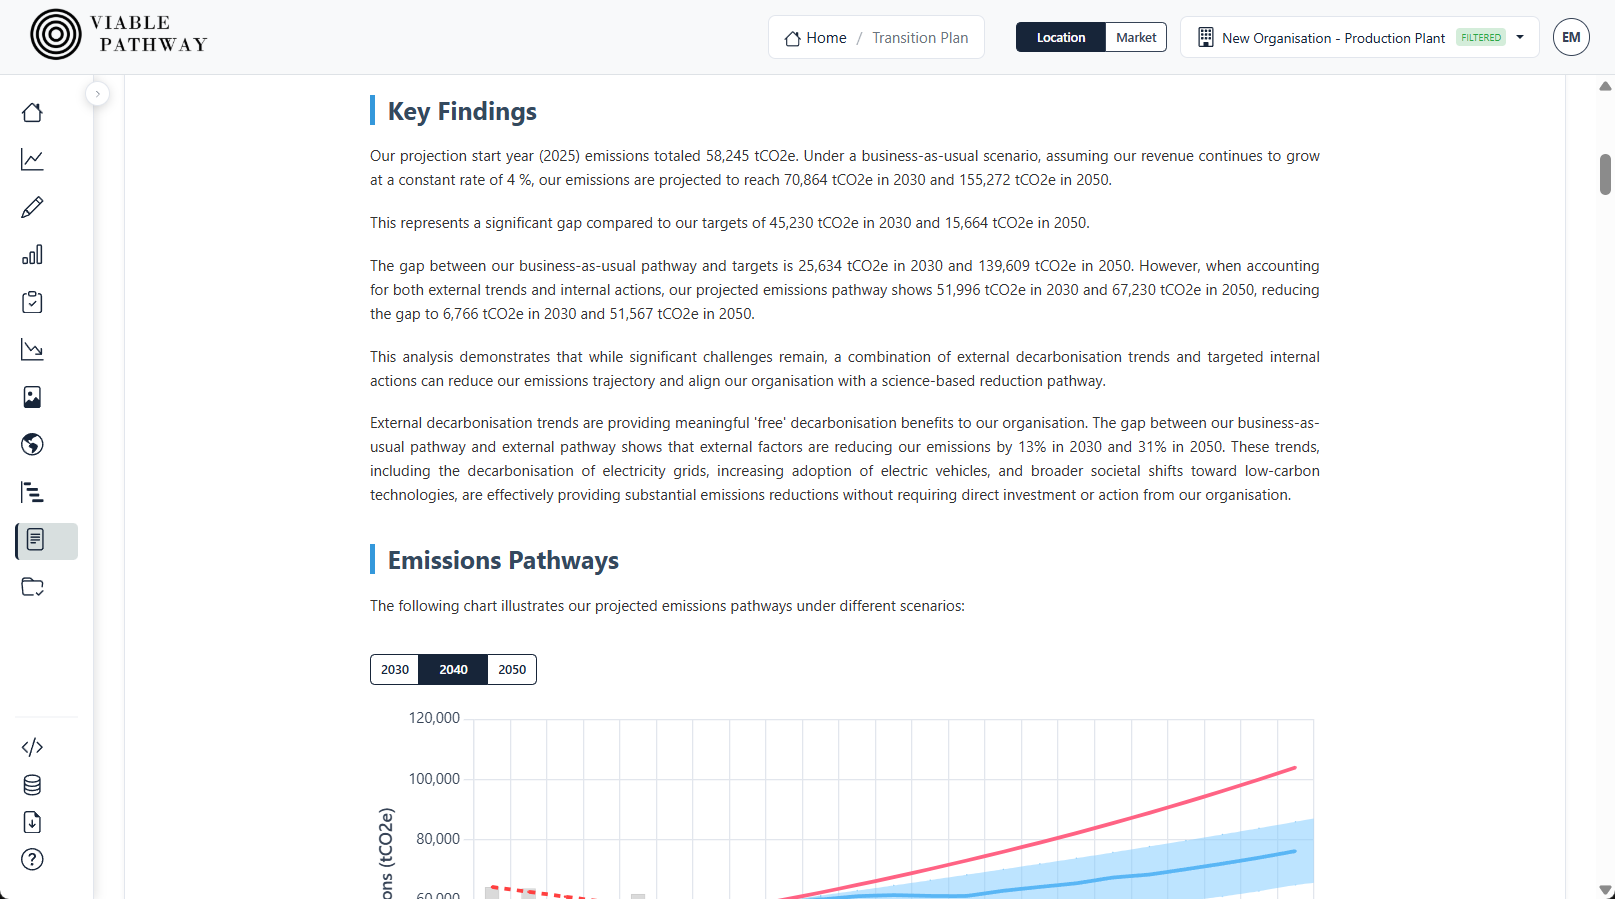
The projection engine models three pathways into the future, and compares these against a carbon reduction target. The effect of external trends is modelled, as well as your carbon reduction actions.
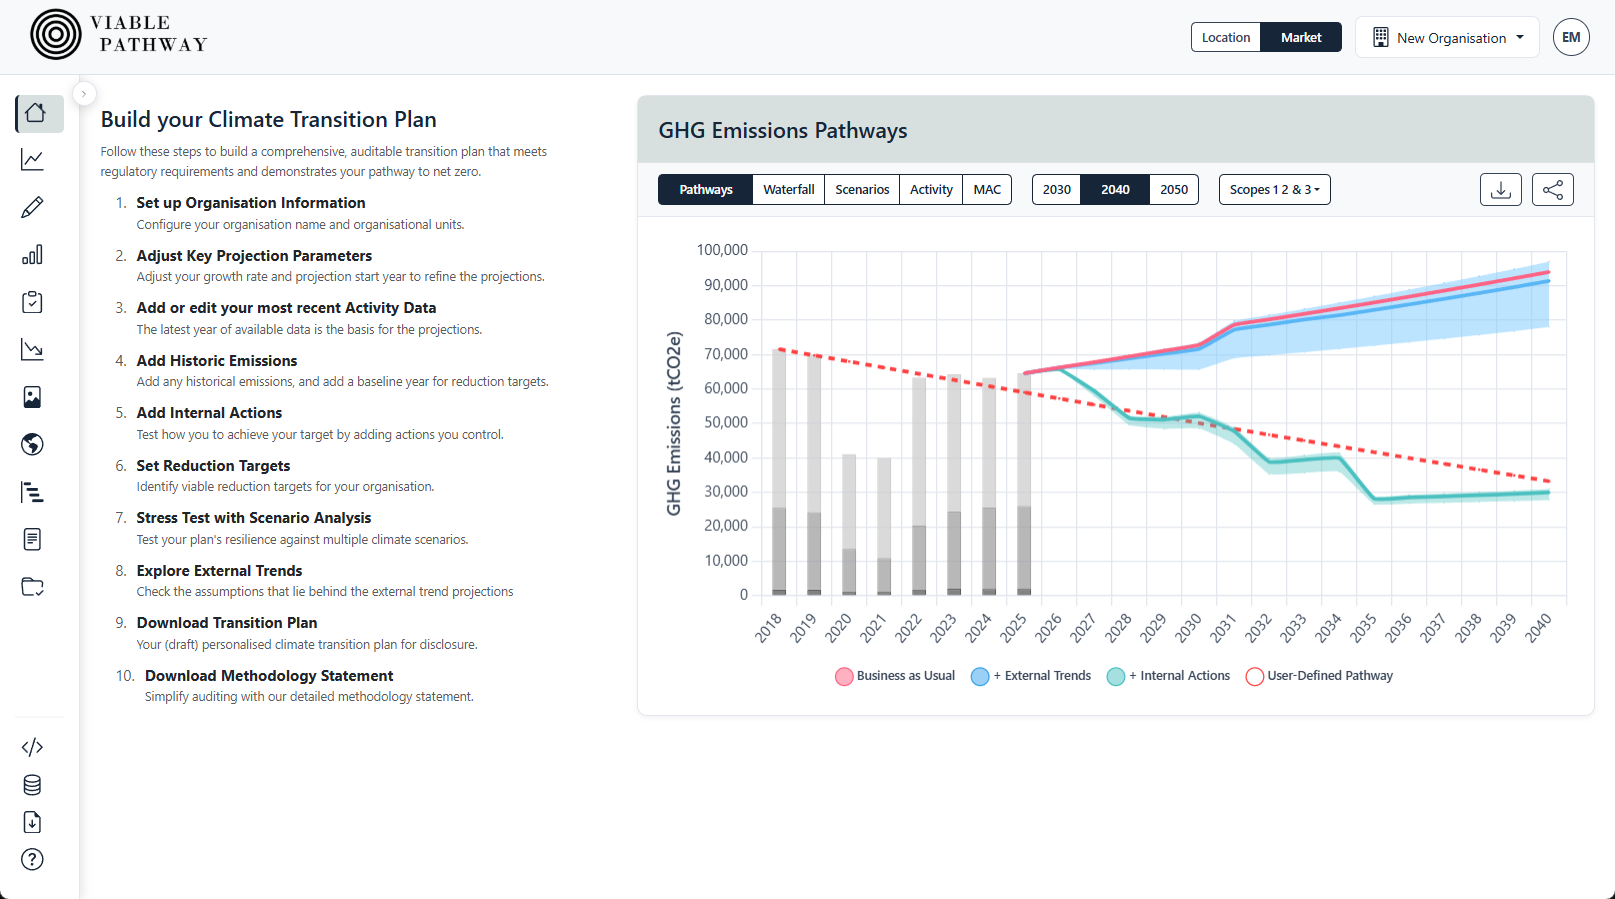
The engine can quickly re-evaluate your transition plan utilising the two differing approaches for measuring electricity emissions. Switching between the two is as simple as toggling a switch.
Add the effect of each of your planned carbon reduction targets into the tool. Either set a % reduction or input an actual reduction value (e.g. 1000 kWh) and see the effect instantly on your transition plan.
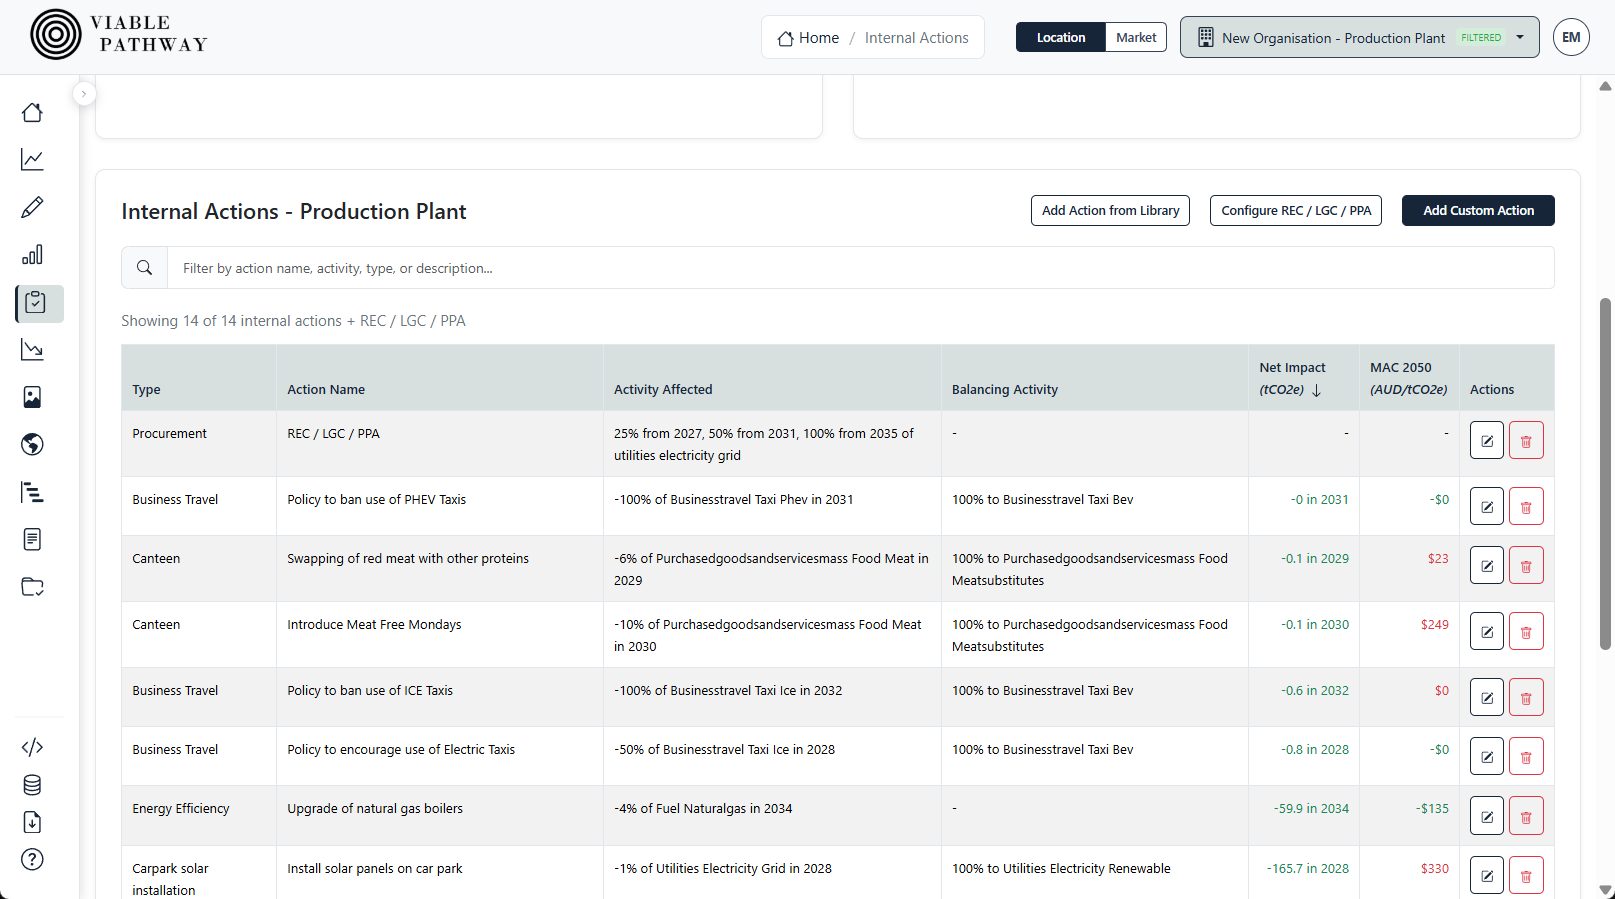
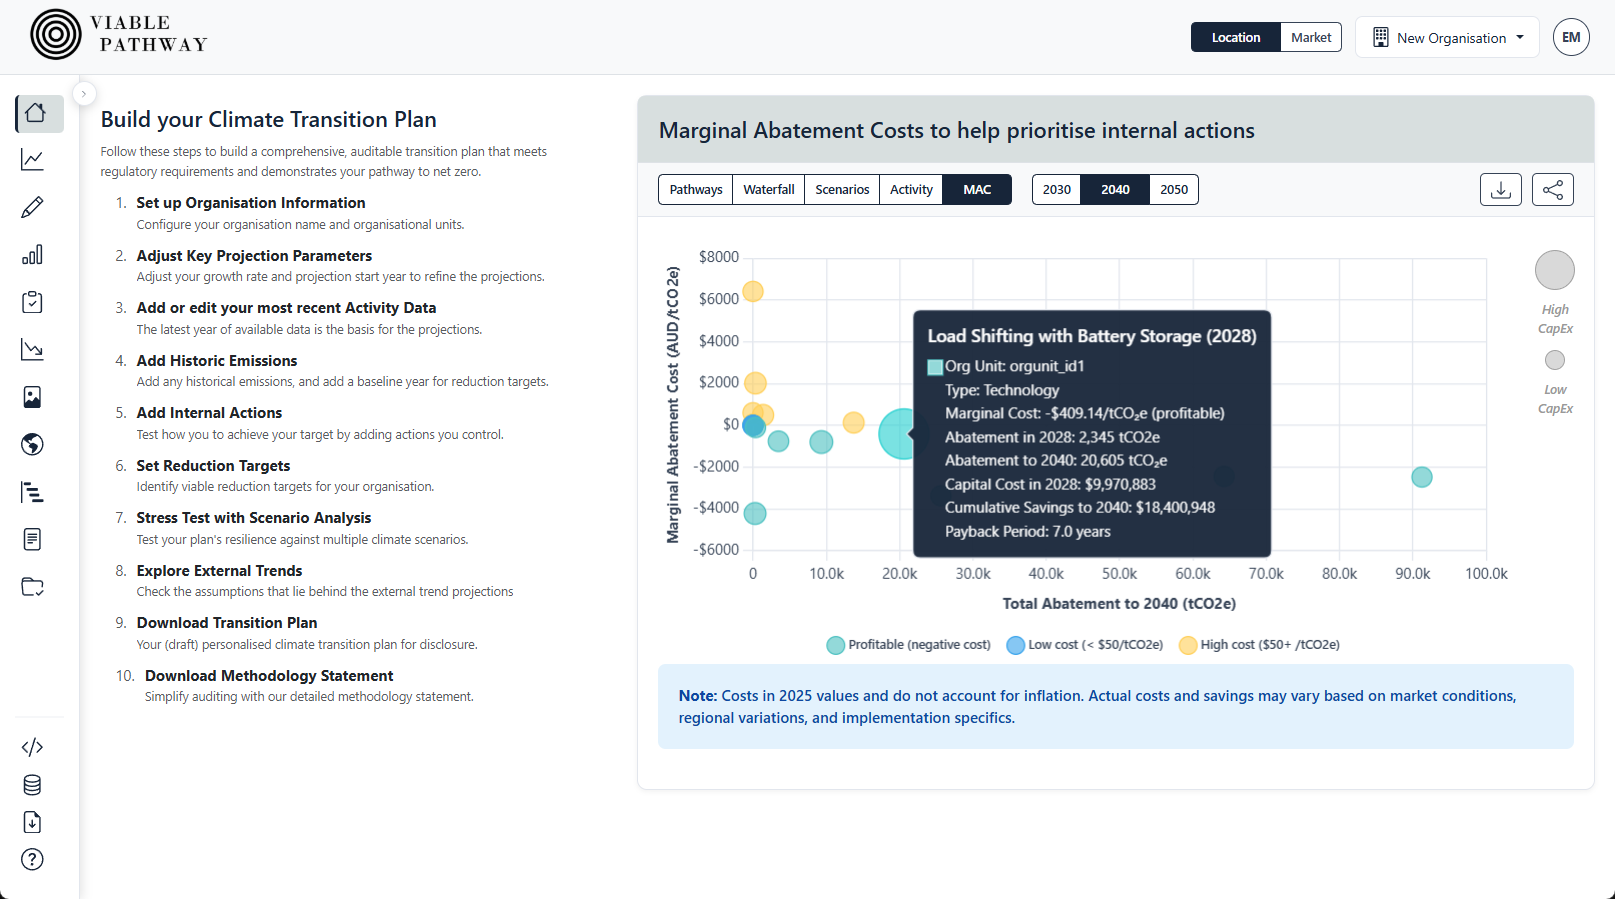
The projection engine evaluates the carbon and cost impact of each of your proposed actions, and visualises these all together on a MAC Curve. This helps you review and re-prioritise actions.
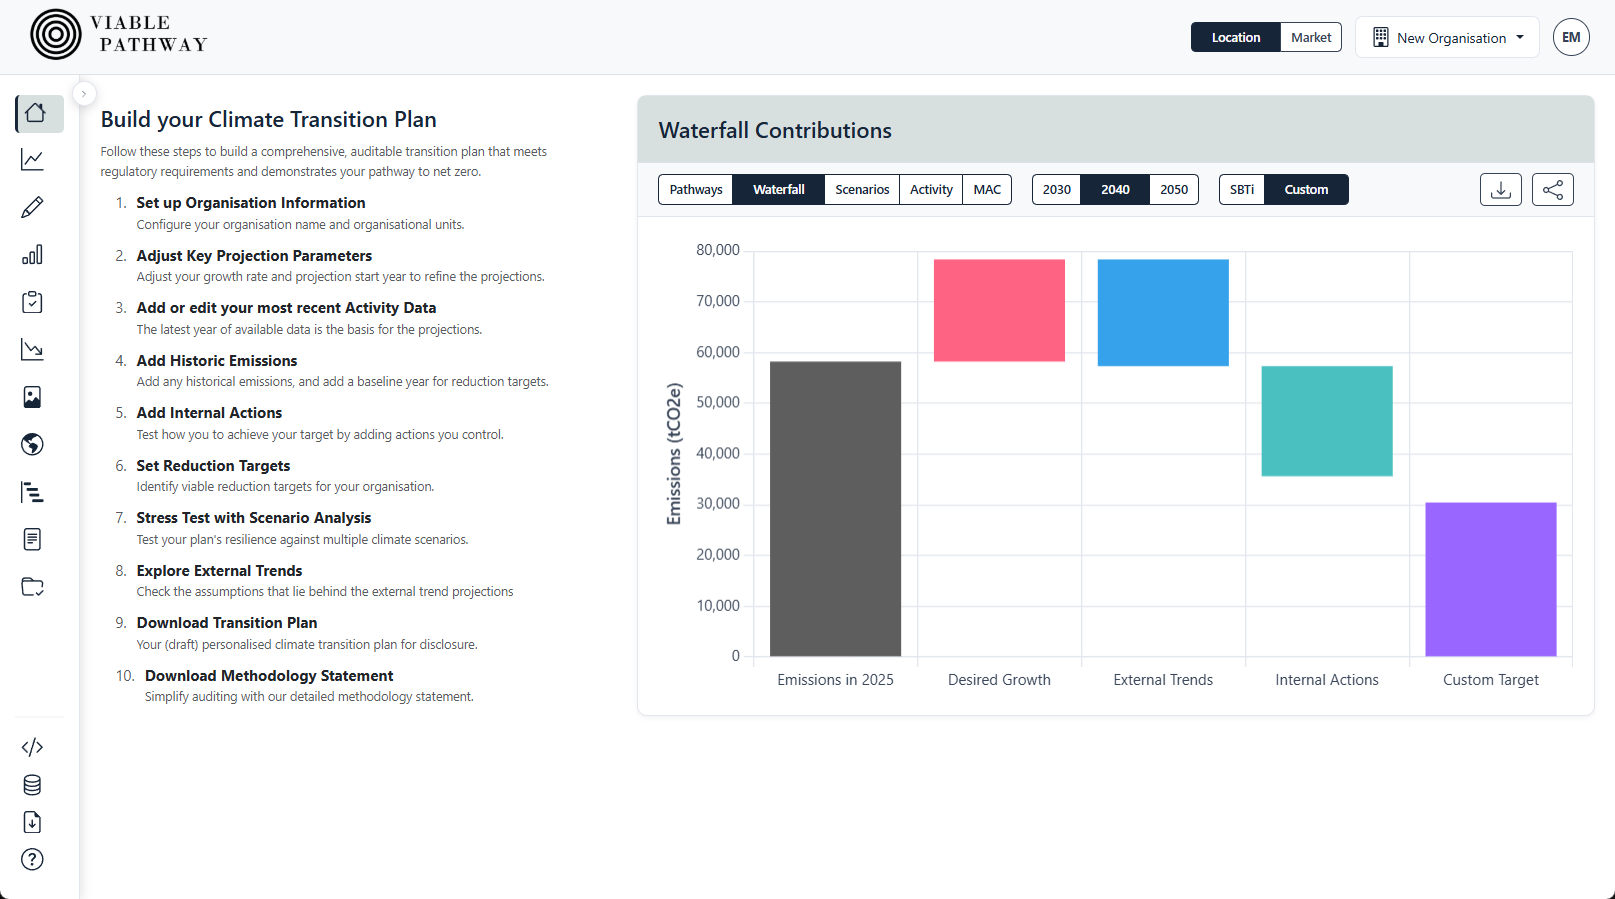
Your transition plan can be evaluated in different charts. A waterfall diagram is incredibly useful to see the effect of each of the main components: growth, external trends, and your internal actions.
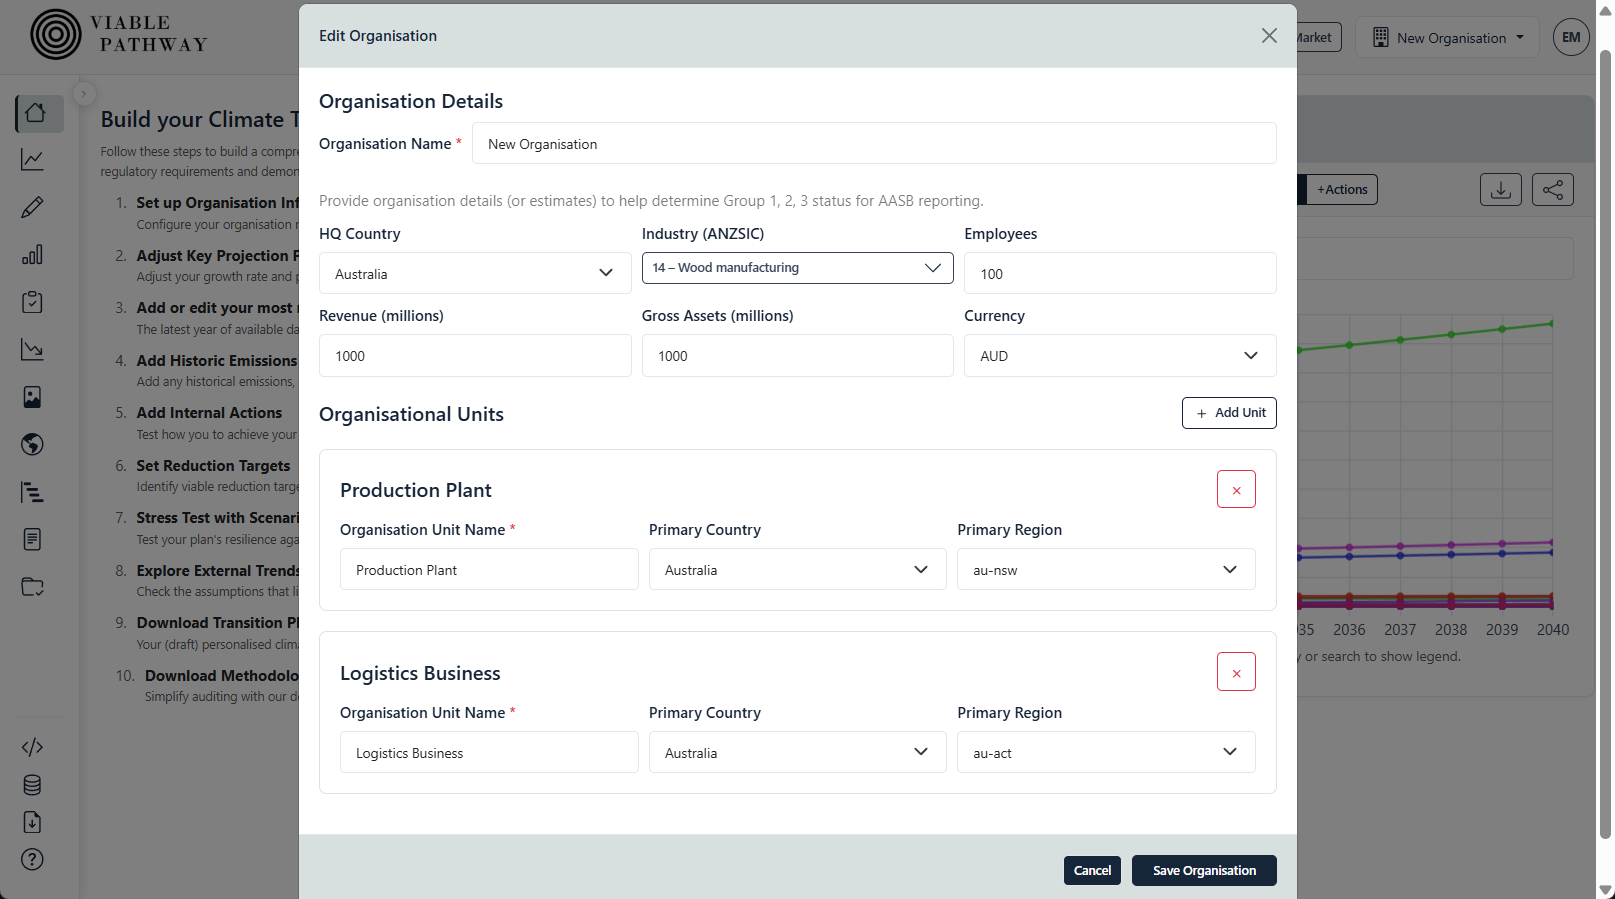
The future growth can be adjusted for the whole organisation, or individual units, or even individual activities. In this way you can add as much detail to your modelling as you need.
Our scenario analysis feature runs your transition plan through multiple SSP variations, to see how it stacks up if the rest of society either decarbonises slowly or quickly. Useful to stress-test and build confidence in target.
Take the guesswork out of your reduction target by setting and adjusting either a custom or SBTi target line. These are overlaid onto your pathways, so you can see what additional actions are required to meet your target, or adjust your target given your budget for actions.
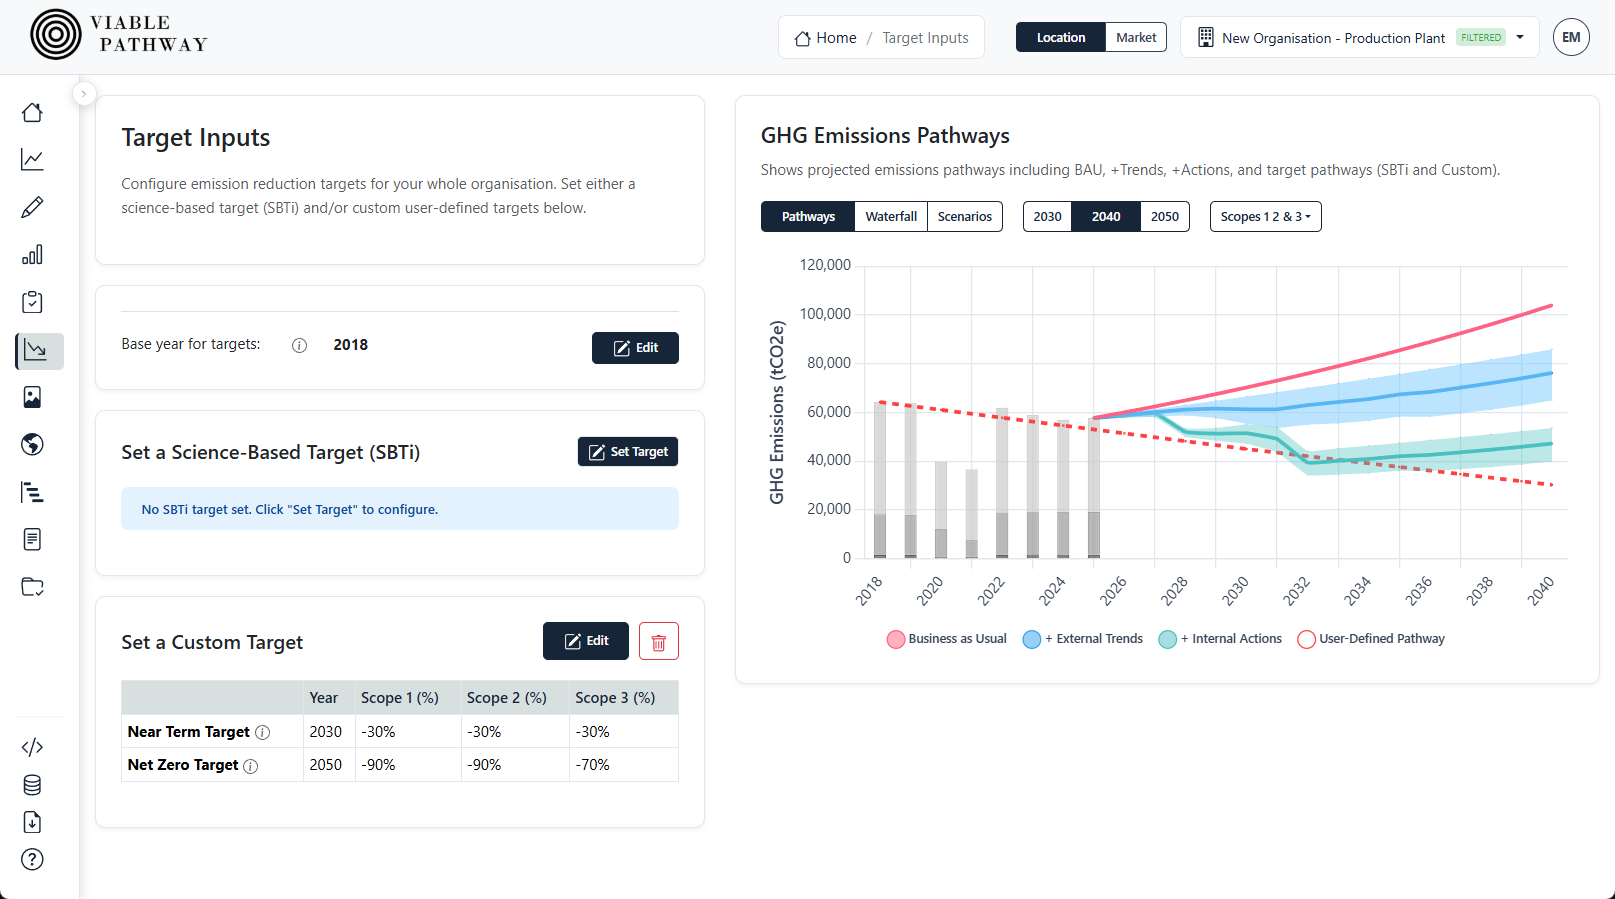
For organisations with multiple units, you create each unit separately and can model individual pathways, and then also view the whole organisation too.
Once happy with your transition plan, download an automated report that captures all of your work, from initial assumptions to each individual action. And don't worry we don't use AI for this step, so no random slop, and your data isn't captured by the tech overlords.
If you want to dive into the core data, you can always export all your data into excel at any point.
Whether you own the target, serve clients, or hold the portfolio, we can help.
Why
Need help setting a viable reduction target? One that will stand up to auditors scrutiny and won't get your CFO hauled in front of the courts?
What
Build your own transition plan, and fully understand the costs and implications behind your roadmap. Download a draft transition plan and all the data in Excel.
Why
Overwhelmed with clients asking for help with their transition planning? Wish there was a more user-friendly way to collaborate with your client instead of getting lost in version-hell with editing out-of-date Excel sheets?
What
Imagine quickly building a transition plan after uploading a GHG inventory file, and then inviting your client to view the plan online, and editing the plan with them live, showing them the impact of each of their actions in real time. No more telling them you'll get back to them in a week once you've re-run the numbers.
Why
Ever wondered if your PortCo has a viable pathway to net zero, and what it might cost? What about doing a net-zero DD before an acquisition?
What
Understand the costs associated with each of your investments reaching an SBTi or custom target by 2030 or 2040. Invite consultants to build a plan for each PC, and then drill down to see each individual transition plan, or pull back to view your portfolio's aggregated position.
Why
Your users have built their GHG inventories in your software, but now what? They need help setting a viable target and building their transition plan.
What
Use our API projection engine and build your own Transition Planning feature directly into your own tool. Let Viable Pathway take care of keeping up to date with the latest data and trends.
Guides, demos, and tools to go deeper.
Emission trends
Free decarbonisation trend pages for electricity, fuels, travel, and more.
Blog
Long-form ideas on transition planning, strategy, and emissions.
Demo
Full live demo of the pathway tool (opens in a new tab).
Key documents
Downloadable resources and reference material.
API access
Use the projection engine from your own software.
Learn how pathways, scenarios, and standards fit together.
Our team
Who we are and why we built Viable Pathway.
What are projections?
How we turn activity data into forward-looking emissions.
What are different pathways?
BAU, external trends, internal actions, and the target line.
Scenario analysis explained
Stress-testing your plan when society decarbonises faster or slower.
AASB compliance
How transition planning lines up with Australian sustainability reporting.
UN Sustainable Development Goals
How our mission aligns with climate action and responsible production.