What are different pathways?
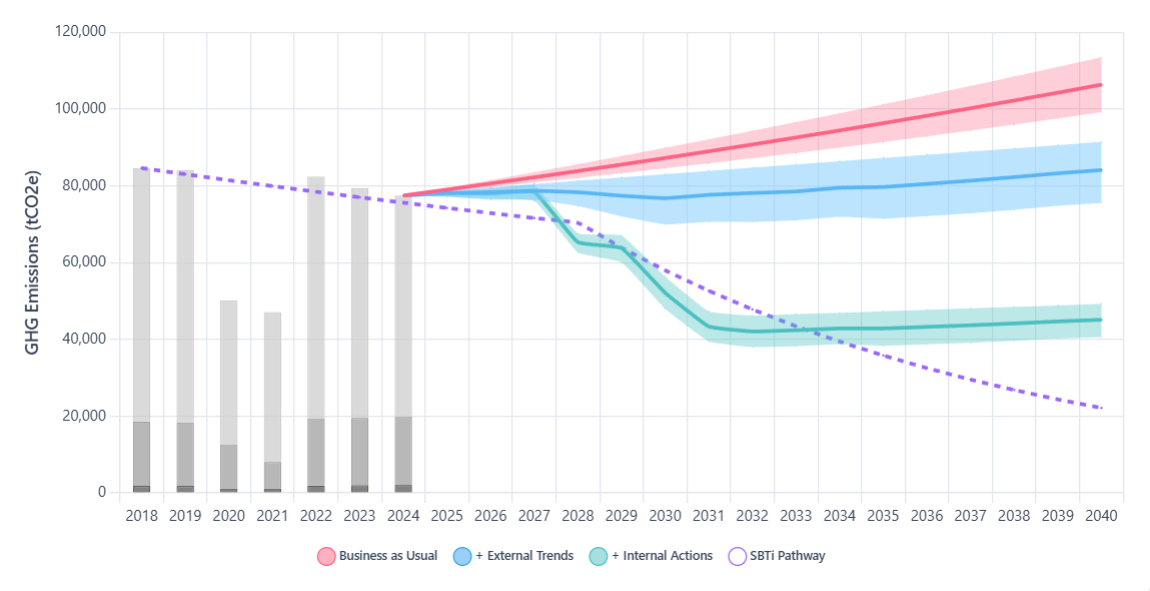
Viable Pathway separates business as usual, external trends, internal actions, and target pathways so you can see where emissions come from—and what it takes to close the gap to net zero.
Recommended by TCFD
Our projections address the Recommendations of the Task Force on Climate-related Financial Disclosures (TCFD).
They recommend disclosing “the resilience of the organisation's strategy, taking into consideration different climate-related scenarios, […] to test the achievability of the transition plan and associated targets.”
A characteristic of effective climate-related metrics is that they are forward-looking. Forward-looking metrics may be based on methodologies such as scenario analysis, trend analysis, sensitivity analysis, and simulations, as well as commitments and climate-related targets.
Forward-looking data are reported as ranges based on assumptions about the future state of the world, often tied to one or more plausible climate scenarios.
Methodology foundations
Our multi-projection approach is based on the methodology C40 Cities have been using to develop Climate Action Plans since 2005. Their Implementation Guide sets out how to use scenario planning to identify and achieve mitigation targets by taking into account external trends and internal actions.
In the context of cities, C40 Cities take into account planned city, regional, and national actions that are expected to reduce community-wide GHG emissions in future years. The scenario may also include non-policy driven market trends when there is adequate evidence that such a trend is likely to occur.
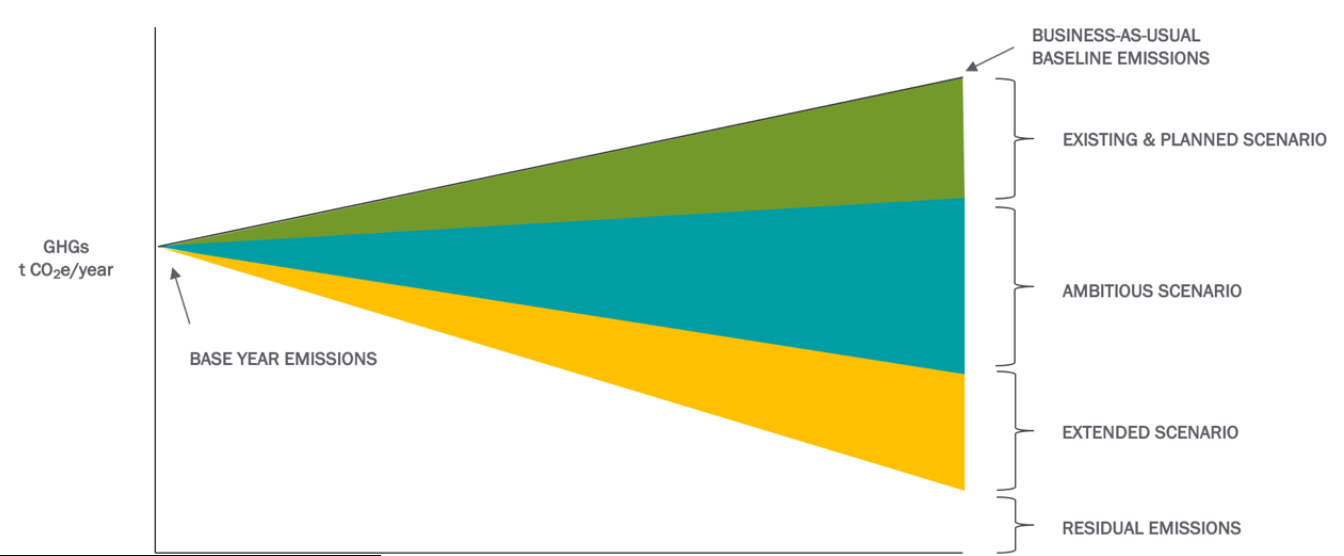
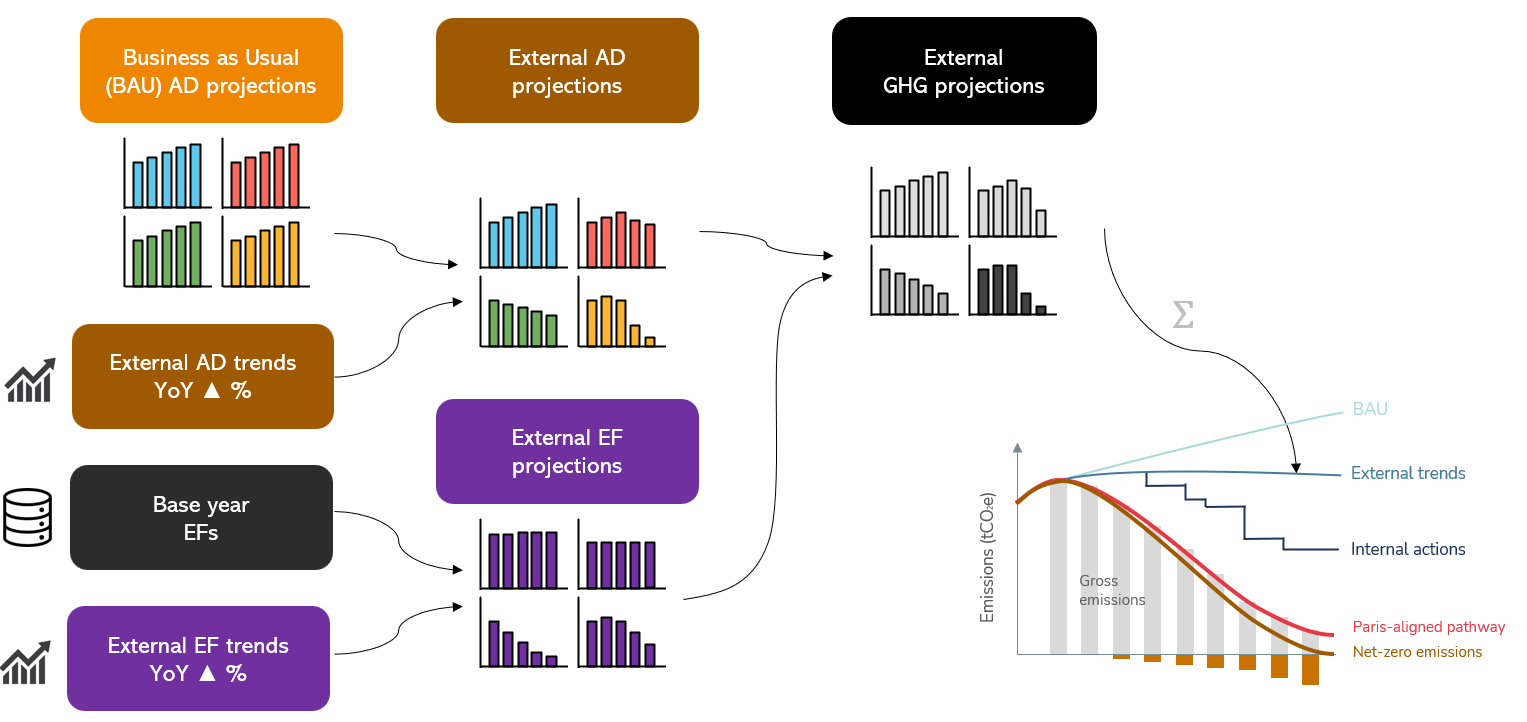
Business as Usual pathway
The BAU pathway assumes a scenario where the company continues its operations without any significant changes to its current practices.
The model assumes there are no external trends, nor any internal actions.
This projection is crucial as it establishes a baseline, illustrating what the future would look like if the company grows at the selected growth percentage.
This pathway is relatively unrealistic, but is useful nonetheless to understand the potential risks and impacts of inaction.
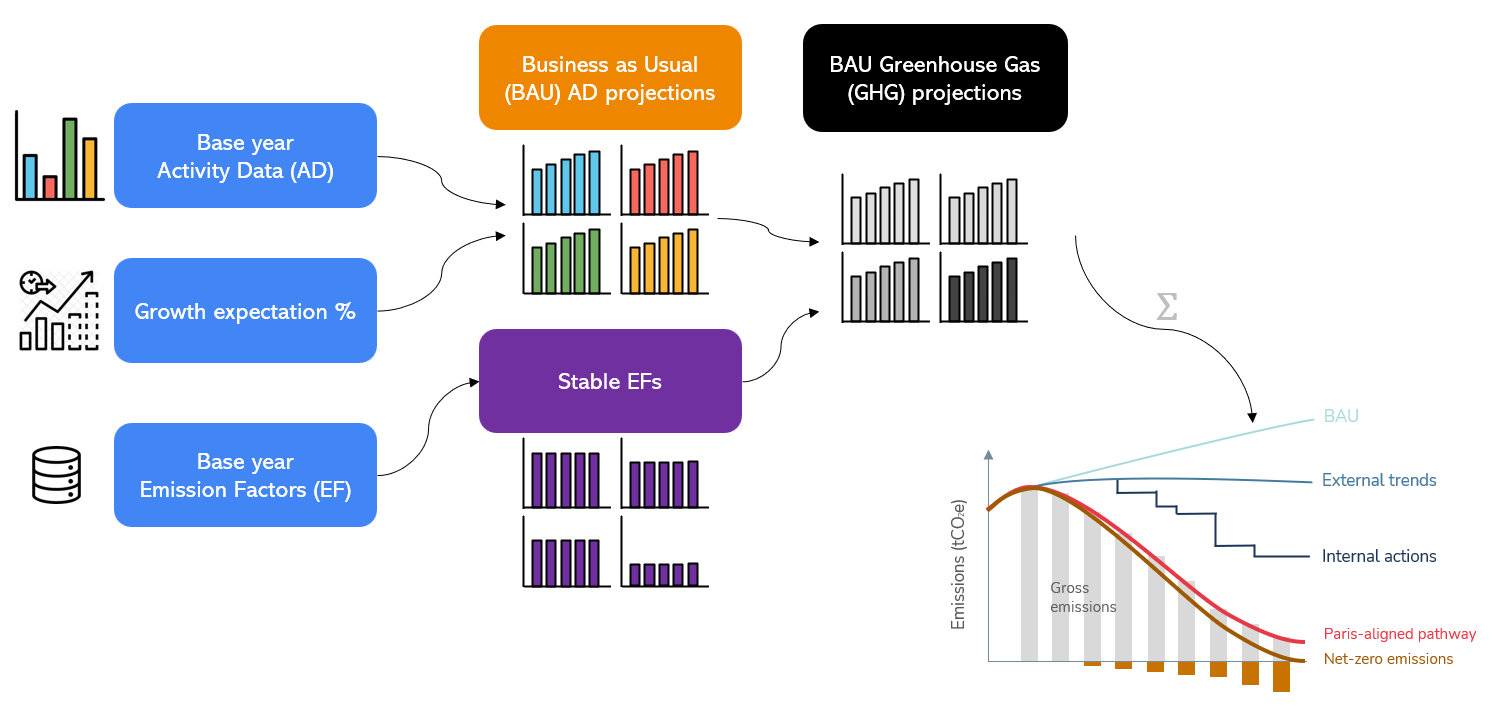
External trends pathway
This pathway accounts for a myriad of external trends that are expected to influence the company's operations and emissions profile over time.
There are two types of trends: emission factor trends and activity data trends.
Emission factor trends, as the name implies, are expected changes in the emission factors. The best example is the decarbonisation of the electricity grid, which means that users of electricity will benefit from reductions in their emissions even if they continue to consume the same power every year.
Activity data trends are the expected shifts in use patterns in society. The best example is the adoption of electric vehicles by employees worldwide in place of their ICE vehicles, which is reducing commuting emissions in most companies.
There are dozens of external trends that are providing ‘free’ decarbonisation, and reducing the effective baseline from which internal actions are planned.
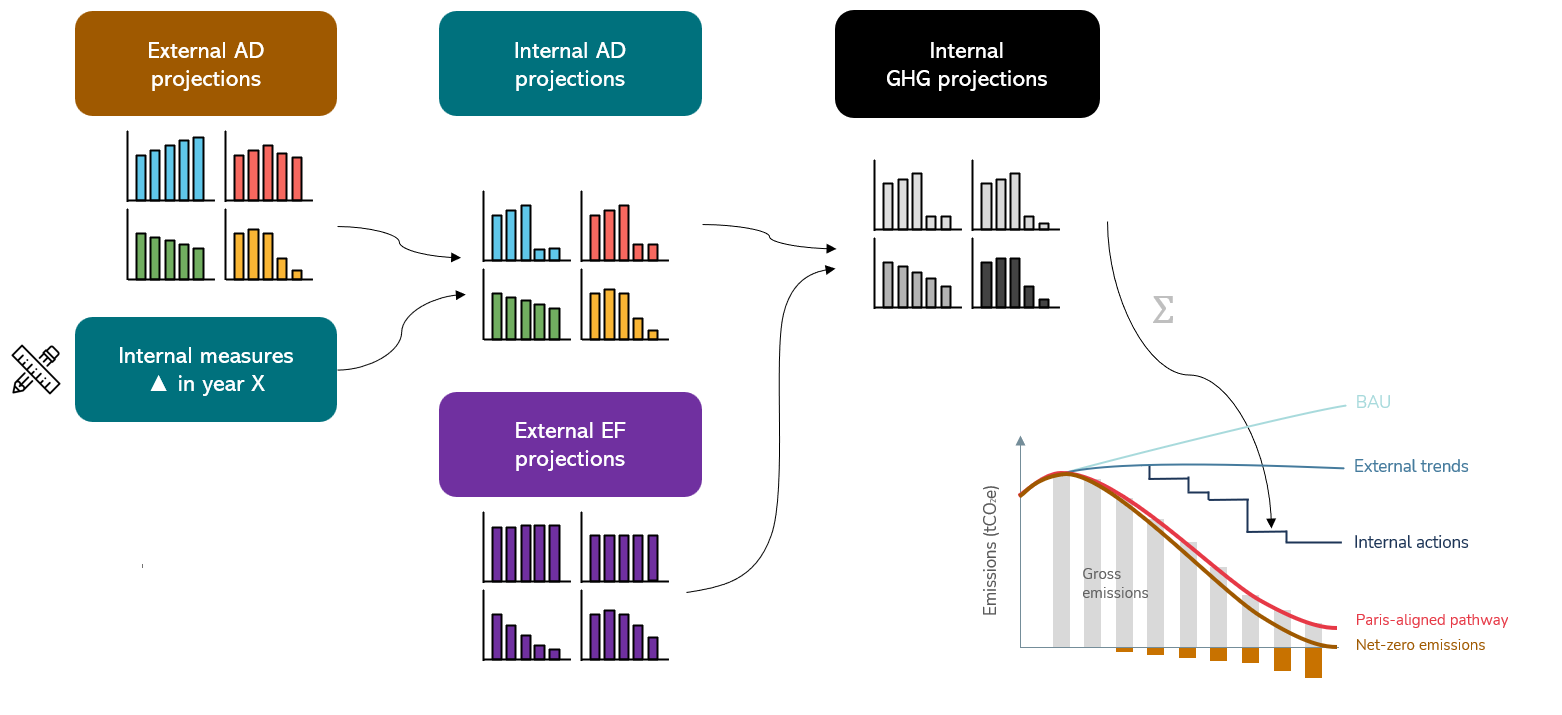
Internal actions pathway
The internal pathway models the impact of planned actions that the company might deploy to reduce carbon emissions. Typical actions include:
- Energy efficiency upgrades in manufacturing processes.
- Transitioning to renewable energy sources.
- Enhancing waste management practices.
- Implementing carbon capture and storage technologies.
The effectiveness of each action is determined by the scale of the change in activity data, and the evolving emission factor, as well as the cumulative impact of all the other actions. The interconnected nature of a company's operations means that complex modelling is required to identify the actual potential of each action.
Crucially, the interplay between the external trends and the internal actions means that some actions may initially have a significant reduction impact, but diminish each year. This is particularly true of electricity efficiency measures, whereby reducing consumption of 1 MWh in 2030 provides a smaller reduction in emissions than in 2025.
Target pathways
While there has been rightful criticism of the Science Based Targets initiative (SBTi) recently, its essence is still a fundamentally useful target pathway for defining the scale and speed of decarbonisation required for ‘net-zero’.
Therefore Viable Pathway overlays an SBTi reduction target pathway necessary to meet both near-term (5-year) and long-term (2050) net-zero goals. This allows users to evaluate their internal action scenario against internationally recognised standards and best practice.
User-defined targets can also be added.