External trends research approach
To deliver projections you can trust, we’ve built a clear, repeatable methodology

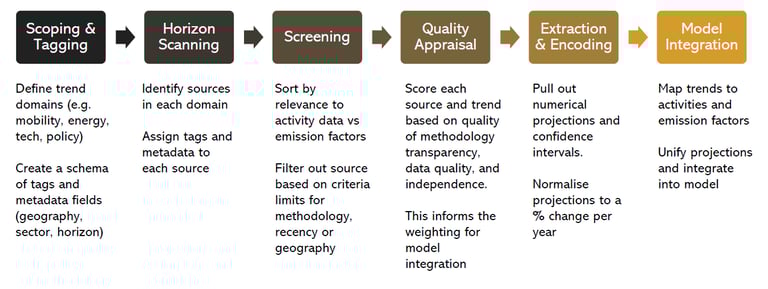
Trend-Curating Workflow
We start by acknowledging that the future exists independently of our models, even if we can only ever know it imperfectly. Our stance is critical-realist, meaning we:
Treat every trend as a testable hypothesis, not gospel
Triangulate quantitative data, peer-reviewed studies, and expert judgment
Update our beliefs Bayesian-style as new evidence arrives
Next, we funnel raw information through a six-step pipeline—from tagging and horizon-scanning all the way through to model integration. At each stage we assign metadata, screen for relevance, appraise quality, extract numerical projections, and map everything back onto our activity & emission-factor models.
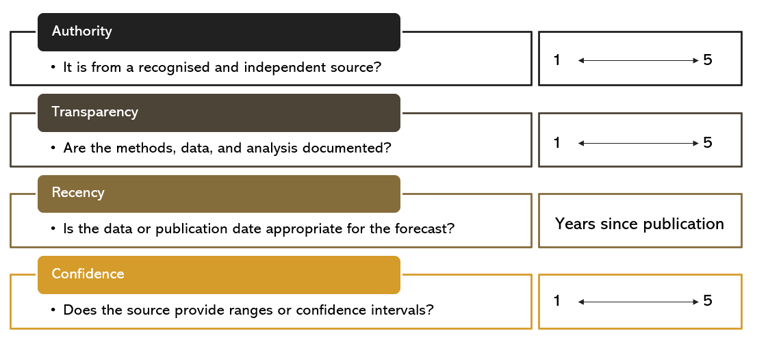
Not all sources are created equal. We score every input on four simple, transparent dimensions:
Authority (Is this an independent, reputable source?)
Transparency (Are the methods and data fully documented?)
Recency (Is the analysis timely for our projection horizon?)
Confidence (Are ranges or error bands provided?)
Quality-Assessment Criteria
click to expand
click to expand
Auditability Pillars
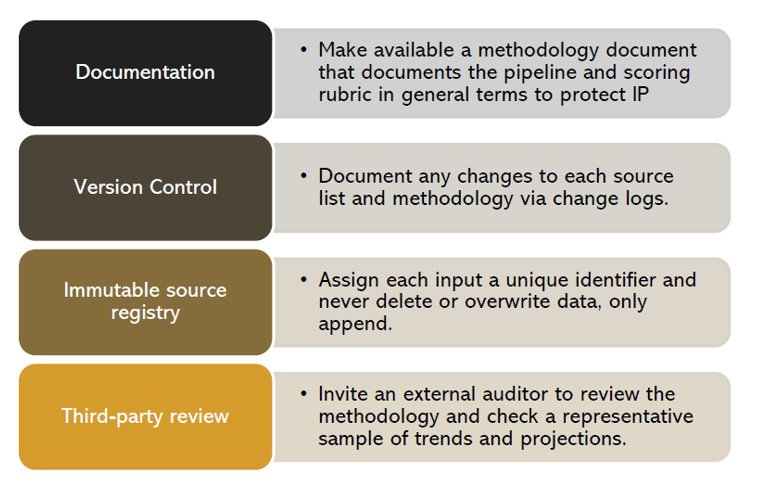
Finally, to prove our work can stand up to scrutiny, we bake in four audit-ready features:
Documentation of our pipeline and scoring rubric
Version control with clear change logs
An immutable source registry (unique IDs, append-only)
Invite third-party reviews under recognized assurance standards
Together, these four elements—philosophy, pipeline, quality scoring, and audit controls—ensure every trend in our engine has a clear provenance, rigorous vetting, and documented credibility.
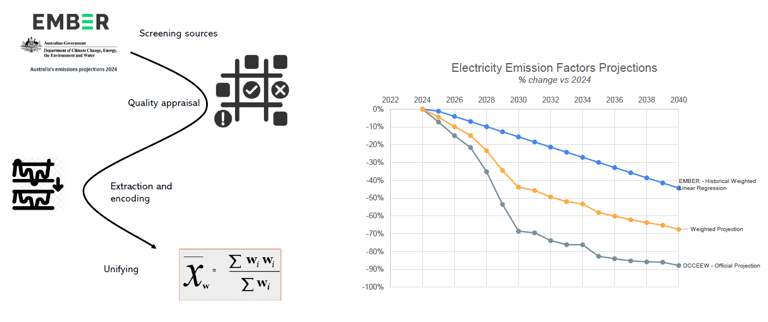
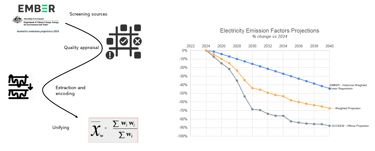
As a simple example, our projection and uncertainty range for the decarbonisation of Australian electricity is drawn from two primary sources. The best case scenario is sourced from the official DCCEEW Australia's Emission Projections 2024. However given other sources are less optimistic, especially given the expected increase in electricity consumption from data centres, our worst case projection is a historical weighted linear regression, based on data from Ember Data Explorer.
A weighted projection based on the Quality Assessment Criteria identifies a projection between the best and worst case scenarios, which informs our calculations of emission reductions, albeit the uncertainty range is also used to provide an understanding of the range of possible futures.
Decarbonisation of electricity as an example
click to expand
click to expand
Epistemological Framework